


The bears are now left grasping at straws. What about tariffs? What about inflation? What about recession? What about the Fed? What about interest rates? What about the Middle East? What about the deficits? Blah, blah, blah.
When it comes to the media, you need to bury your head in the sand. Actually, take your head out of the sand and bury it in the charts. That’s where you’ll find the truth.
I said all-time highs were coming back at the April low and here we are. The S&P 500 has set a new all-time record high today and, barring a significant afternoon decline, will set its all-time closing high above the previous closing high of 6144, which was set on February 19, 2025. This new high comes just as we begin to prepare for Q2 earnings season. The run up to earnings season is generally and historically quite strong, so get ready for more highs ahead.
Since 1950, the S&P 500 has produced annualized returns of nearly 27% during the period June 28th through July 17th. This annualized pre-earnings run is nearly triple the average S&P 500 annual return of 9% since 1950. Care to guess how the NASDAQ and Russell 2000 have fared during this bullish pre-earnings period?
- NASDAQ: +38.67%
- Russell 2000 (IWM): +32.61% (bullish period ends July 15th for small caps)
Clearly, the bulls have the historical advantage for the next 3 weeks. Technically, evidence began turning in the bulls’ favor in mid-March, despite the last big move lower in early April. I have the research to back that up and will discuss it at an event on Saturday (more details below). While the stock market was rapidly declining in April, Wall Street was happily stealing everyone’s shares during the panicked selloff.
Technical Strength
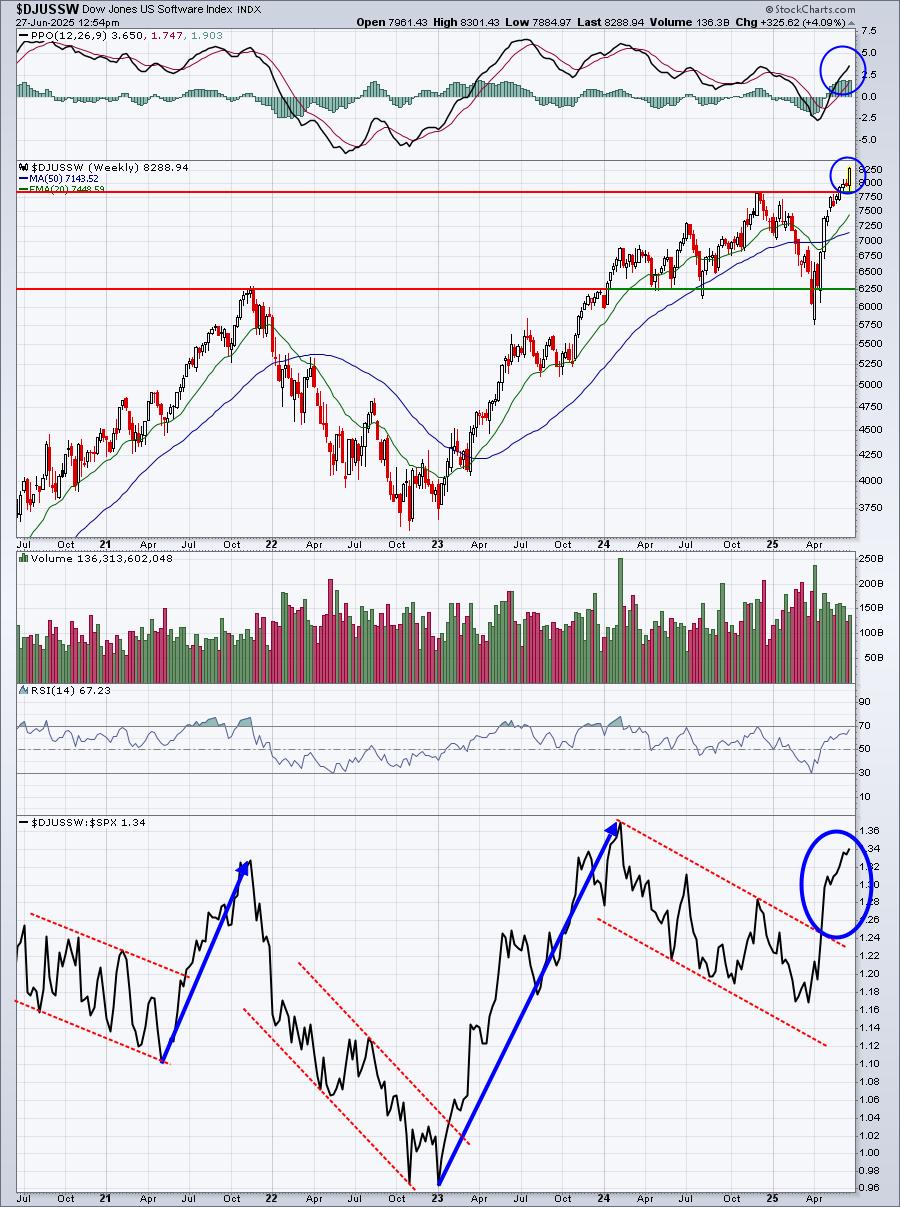
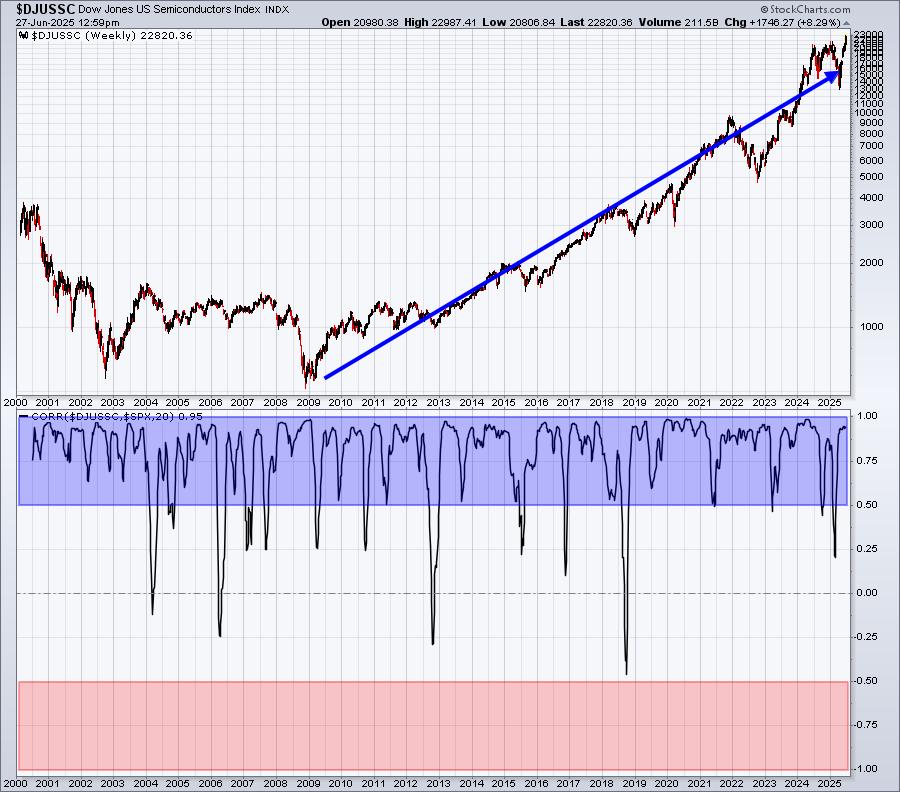
Two of the most important industry groups to follow are semiconductors ($DJUSSC) and software ($DJUSSW). These two groups are among the most influential in terms of driving the S&P 500 higher. Check out both of these charts and be sure to check out both the absolute and relative strength currently.
Semiconductors:
Software:
Now I’m going to provide charts of these same two groups, but this time show you how positively they correlate to the S&P 500’s direction over the course of this century.
Semiconductors:
Software:

Honestly, you don’t need a PhD in Economics to understand the above charts. It’s really quite simple. When semiconductors and software are rallying to new highs and showing relative strength, BUY U.S. stocks! They both have extremely tight positive correlation with the S&P 500 and they both look very technically sound right now.
Interest Rate Cut
It’s coming and it’s coming fast! I’m now convinced that the Fed will cut the fed funds rate in a month at their next scheduled meeting on July 29-30. I’m not saying it because I feel the Fed should cut or needs to cut. I’m saying it because there’s a ton of buying right now in the 1-month treasury, sending its yield down. The 1-month treasury yield ($UST1M) typically begins to move BEFORE any Fed action occurs. We saw it back in August/September 2024, just prior to the 50 basis point cut at the September 2024 meeting:
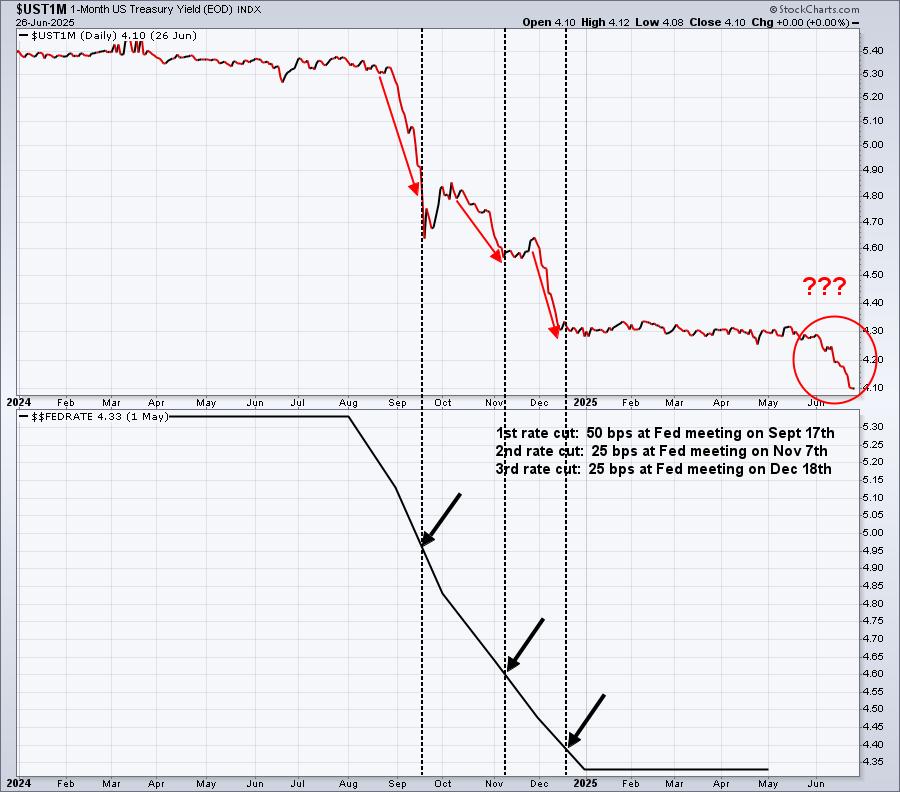
The black directional lines in the bottom panel mark approximately the date that the Fed lowered the fed funds rate. The red directional lines in the top panel highlight the downward movement in the $UST1M PRIOR to the Fed’s lowering roughly a month later. Again, I’m not making this stuff up. The charts are telling me a story here and the current story is that rates are about to come down.
Checkmate bears.
Follow the charts, not the media!
The Game
I’m beginning to believe that capitulation is nothing more than a staged event for the Wall Street elite and we’re the panicked pawns running around with our hair on fire. Those days are over for EarningsBeats.com members. We saw this one coming, just like we saw it coming in 2022. Getting out at the top with the Wall Street elite and getting back in at the bottom before them is an excellent recipe for beating the S&P 500 by a mile!
Learning is the key. We focus on market research, guidance, and education at EarningsBeats.com. Those are our 3 pillars of business. Calling the 2025 market top wasn’t a coincidence. We’ve done it before and we’ll do it again. Jumping back in near the bottom was no coincidence either. Our signals are proven and they work.
On Saturday morning at 10:00am ET, we’re hosting a FREE educational event, “Trading the Truth: How Market Manipulation Creates Opportunity”. I’m going to show everyone the “play-by-play” of how we were able to move to cash BEFORE the market top and back into stocks NEAR the market bottom. Market tops form with many of the same signals each time. To learn more about this event and to register with your name and email address, CLICK HERE.
If you’ve struggled with all the uncertainty in 2025 and haven’t trusted stocks, it’s time that you change your process and strategies. I’ll see you on Saturday!
Happy trading!
Tom

Tom Bowley is the Chief Market Strategist of EarningsBeats.com, a company providing a research and educational platform for both investment professionals and individual investors. Tom writes a comprehensive Daily Market Report (DMR), providing guidance to EB.com members every day that the stock market is open. Tom has contributed technical expertise here at StockCharts.com since 2006 and has a fundamental background in public accounting as well, blending a unique skill set to approach the U.S. stock market.
Learn More
Source link


