


Last Friday, the S&P 500 finished the week just below 5700. The question going into this week was, “Will the S&P 500 get propelled above the 200-day?” And as I review the evidence after Friday’s close, I’m noting that the SPX is almost exactly where it was one week ago!
That’s right–after all the headlines, tariff tantrums, and earnings reports, the S&P 500 ended the week 0.4% below where it started. This “lack of conviction” week led me to post the following poll on X, asking followers to decide which they felt would happen first: a retest of the February 2025 high or a retest of the April 2025 low.
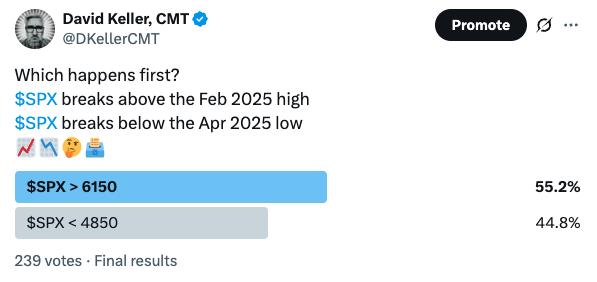
I was actually quite surprised that there wasn’t more optimism after April’s incredible rally phase, but you can see that 55% of respondents thought the February high around 6150 would be hit first. So unlike the AAII survey’s recent readings, there appear to be more bulls than bears out there.
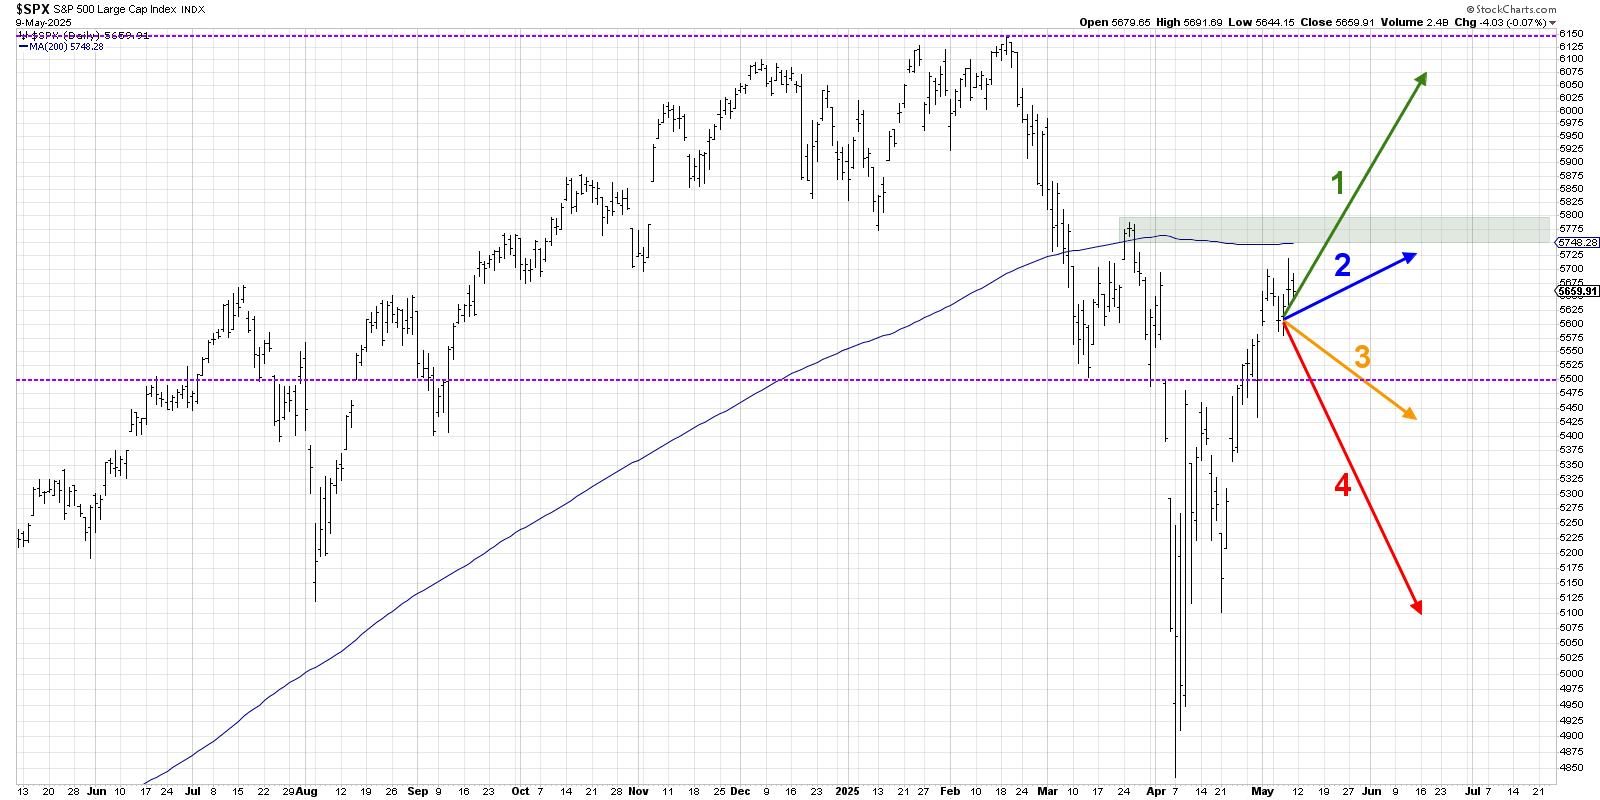
Based on this week’s extended choppiness, I thought it might be good to revisit an approach called “probabilistic analysis” to consider four potential paths for the S&P 500 between now and late June 2025. Basically, I’ll share four different scenarios, describe the market conditions that would likely be involved, and also share my estimated probability for each scenario.
By the way, we last ran this analytical process on the S&P 500 back in January, and you need to see which scenario actually played out!
And remember, the point of this exercise is threefold:
- Consider all four potential future paths for the index, think about what would cause each scenario to unfold in terms of the macro drivers, and review what signals/patterns/indicators would confirm the scenario.
- Decide which scenario you feel is most likely, and why you think that’s the case. Don’t forget to drop me a comment and let me know your vote!
- Think about how each of the four scenarios would impact your current portfolio. How would you manage risk in each case? How and when would you take action to adapt to this new reality?
Let’s start with the most optimistic scenario, with the S&P 500 index continuing the recent uptrend phase to retest all-time highs by June.
Option 1: The Super Bullish Scenario
Our most bullish scenario would mean that the aggressive rally phase off the April low would essentially continue in its current form. After perhaps the briefest of pullbacks at the 200-day moving average, we continue to the upside. This scenario would most likely mean the Magnificent 7 stocks would have to really find their mojo, with names like GOOGL, AAPL, and AMZN finally breaking through their 200-day moving averages.
Dave’s Vote: 10%
Option 2: The Mildly Bullish Scenario
What if the S&P 500 stalls around the 200-day, with a pullback that inspires even more indecision among investors? Perhaps we are still in “wait and see” mode as some tariff negotiations prove fruitful, but empty shipping containers remind consumers of the prospects of chronic inflation. By mid-June, we’re no closer to a real clear sense of direction than we are today.
Dave’s vote: 30%
Option 3: The Mildly Bearish Scenario
Because of the time frame I’ve selected, there won’t be another Fed meeting until after this period is over. So, what if inflation data starts to imply real price issues, consumer sentiment really starts to falter, and the Fed is unable to take any meaningful action to address mounting concerns? If we fail to push above the 200-day moving average soon, then 5500 would be a likely area of support on the way down. This scenario brings us right back down to that level.
Dave’s vote: 40%
Option 4: The Very Bearish Scenario
You always need a bear case, and this one would entail a new distribution phase that takes the major benchmarks down to retest the April low. I’d say a reasonable downside objective would be 5100, and we’ll spend the month of June debating whether we’re forming a huge double bottom pattern or see another bounce higher. Defensive sectors shine as investors rotate big time to risk-off positions.
Dave’s vote: 20%
What probabilities would you assign to each of these four scenarios? Check out the video below, and then drop a comment with which scenario you select and why!
RR#6,
Dave
P.S. Ready to upgrade your investment process? Check out my free behavioral investing course!
David Keller, CMT
President and Chief Strategist
Sierra Alpha Research LLC
Disclaimer: This blog is for educational purposes only and should not be construed as financial advice. The ideas and strategies should never be used without first assessing your own personal and financial situation, or without consulting a financial professional.
The author does not have a position in mentioned securities at the time of publication. Any opinions expressed herein are solely those of the author and do not in any way represent the views or opinions of any other person or entity.

David Keller, CMT is President and Chief Strategist at Sierra Alpha Research LLC, where he helps active investors make better decisions using behavioral finance and technical analysis. Dave is a CNBC Contributor, and he recaps market activity and interviews leading experts on his “Market Misbehavior” YouTube channel. A former President of the CMT Association, Dave is also a member of the Technical Securities Analysts Association San Francisco and the International Federation of Technical Analysts. He was formerly a Managing Director of Research at Fidelity Investments, where he managed the renowned Fidelity Chart Room, and Chief Market Strategist at StockCharts, continuing the work of legendary technical analyst John Murphy.
Learn More
Source link


