


KEY
TAKEAWAYS
- Technology leapfrogs back into top 5 sectors, replacing financials
- Continued volatility suggests lack of sustainable trend
- Weekly RRG shows strength in technology, mixed signals in other top sectors
- Performance gap between top 5 sectors and SPY widens to 7%
This Time Technology Beats Financials
After a week of no changes, we’re back with renewed sector movements, and it’s another round of leapfrogging.
This week, technology has muscled its way back into the top five sectors at the expense of financials, highlighting the ongoing volatility in the market.
Communication Services and Consumer Staples have swapped places since last week, while Technology has entered at number five, pushing Financials down to sixth. The remaining sectors from seven to eleven remain unchanged.
This constant shuffling is a clear indicator of the market’s indecision. Imho, such volatility usually doesn’t accompany a sustainable trend, and that’s precisely what’s hurting trend-following models right now.
- (1) Industrials – (XLI)
- (2) Utilities – (XLU)
- (4) Communication Services – (XLC)*
- (3) Consumer Staples – (XLP)*
- (6) Technology – (XLK)*
- (5) Financials – (XLF)*
- (7) Real-Estate – (XLRE)
- (8) Materials – (XLB)
- (9) Consumer Discretionary – (XLY)
- (10) Healthcare – (XLV)
- (11) Energy – (XLE)
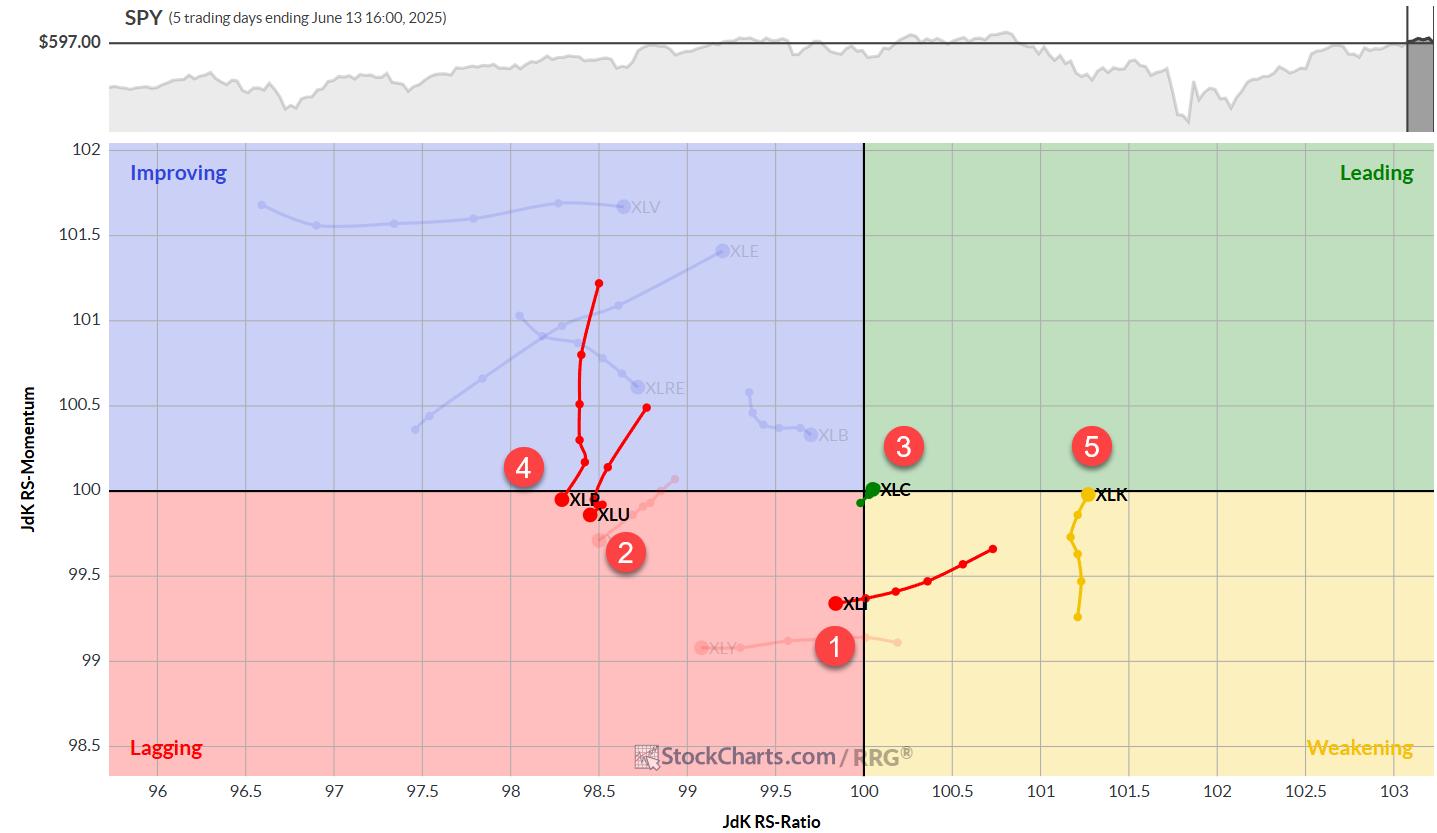
Weekly RRG Analysis
On the weekly Relative Rotation Graph, the Technology sector is showing impressive strength. Its tail is well-positioned in the improving quadrant, nearly entering the leading quadrant with a strong RRG heading. This movement explains Technology’s climb back into the top ranks.
Industrials remains the only top-five sector still inside the leading quadrant on the weekly RRG. It continues to gain relative strength, moving higher on the JdK RS-Ratio axis, while slightly losing relative momentum. All in all, this tail is still in good shape.
Utilities, Communication Services, and Consumer Staples are all currently in the weakening quadrant. Utilities and Staples show negative headings but maintain high RS-Ratio readings, giving them room to potentially curl back up. Communication Services is losing ground on the RS-Ratio scale but starting to pick up relative momentum.
Daily RRG: A Different Picture
Switching our focus to the daily RRG reveals a somewhat different story:
- Industrials has moved into the lagging quadrant, losing ground on the RS-Ratio scale
- Utilities and Staples are rolling back into the lagging quadrant with negative headings — not a great sign
- Communication Services remains close to the benchmark
- Technology shows the strongest tail, nearly completing a leading-weakening-leading rotation
This daily view underscores the strength we’re seeing in the Technology sector on the weekly timeframe.
Industrials: Facing Resistance
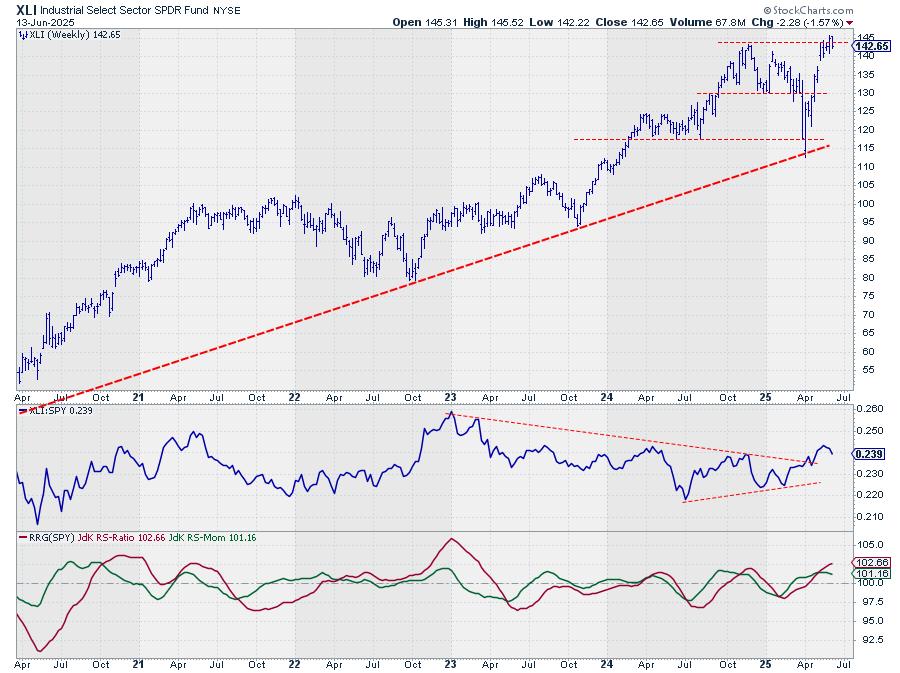
XLI dropped back below its previous high after a strong showing the week prior. There’s significant resistance between $142.50 and $145.
In a worst-case scenario, I think XLI could even retreat to the gap area between $137.50 and $139.
The uptrend remains intact, but more buying power is needed for a convincing break to new highs.
Utilities: Range-Bound
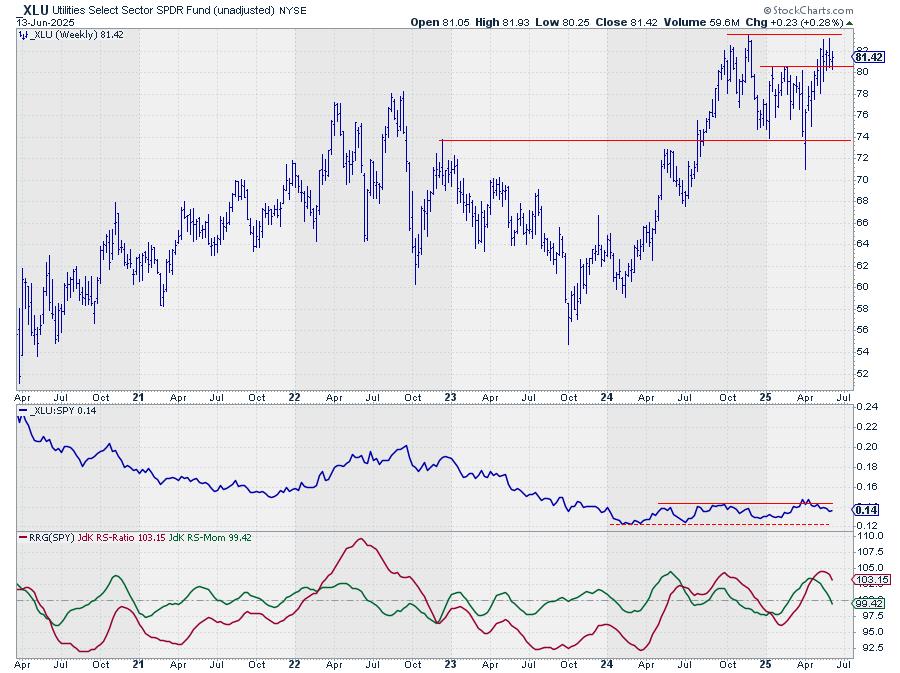
XLU is now trading in a range between roughly $80 on the downside and $83 on the upside.
It needs to break above the former high to continue building relative strength.
The raw RS line has returned to its trading range, dragging both RRG lines lower — not the strongest outlook for this defensive sector.
Communication Services: Testing Resistance
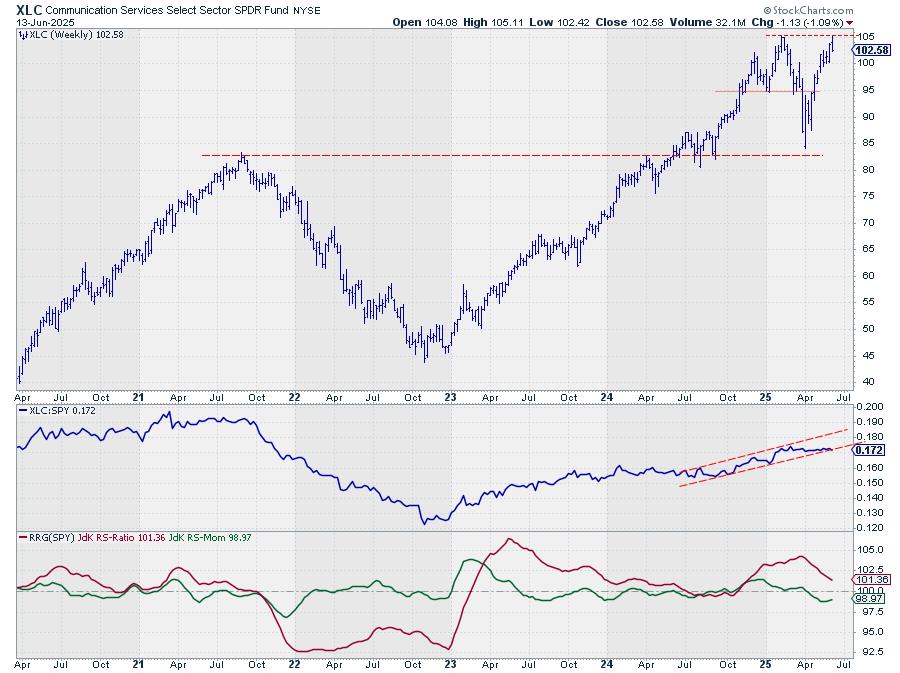
The sector peaked almost exactly at resistance offered by its previous high around $105, then closed at the lower end of the bar.
The raw RS line is managing to stay within its rising channel, albeit horizontally.
A sustained upward price movement is crucial for maintaining relative strength here.
Consumer Staples: Struggling to Break Higher
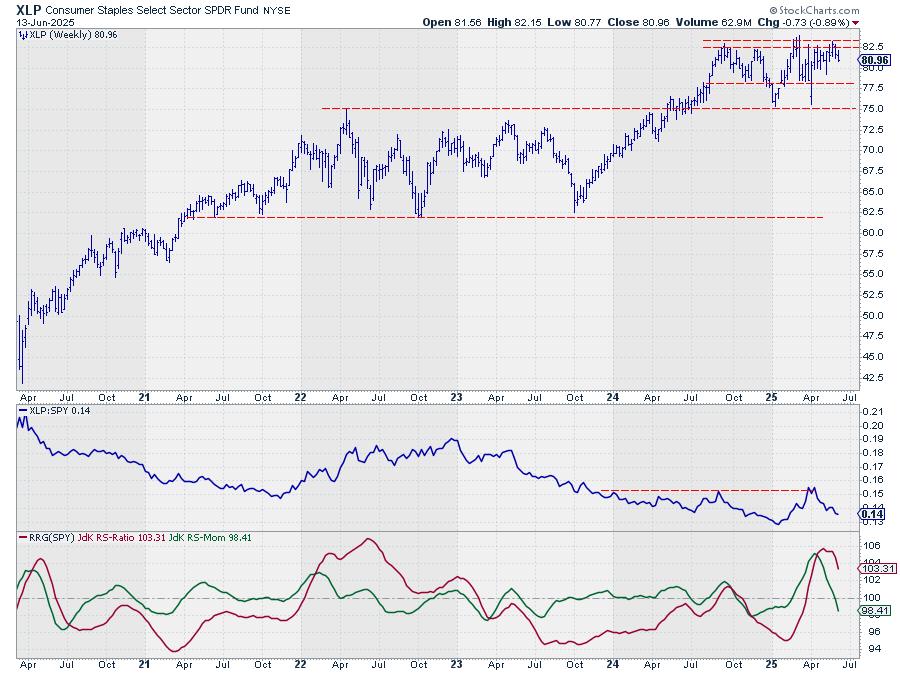
XLP continues to face heavy overhead resistance between $82 and $83.
Its inability to break higher is starting to hurt relative strength.
The raw RS line has moved down from a recent high, dragging the RRG lines lower.
The RS-Momentum line has already crossed below 100, positioning the weekly tail inside the weakening quadrant.
Technology: The Comeback Kid
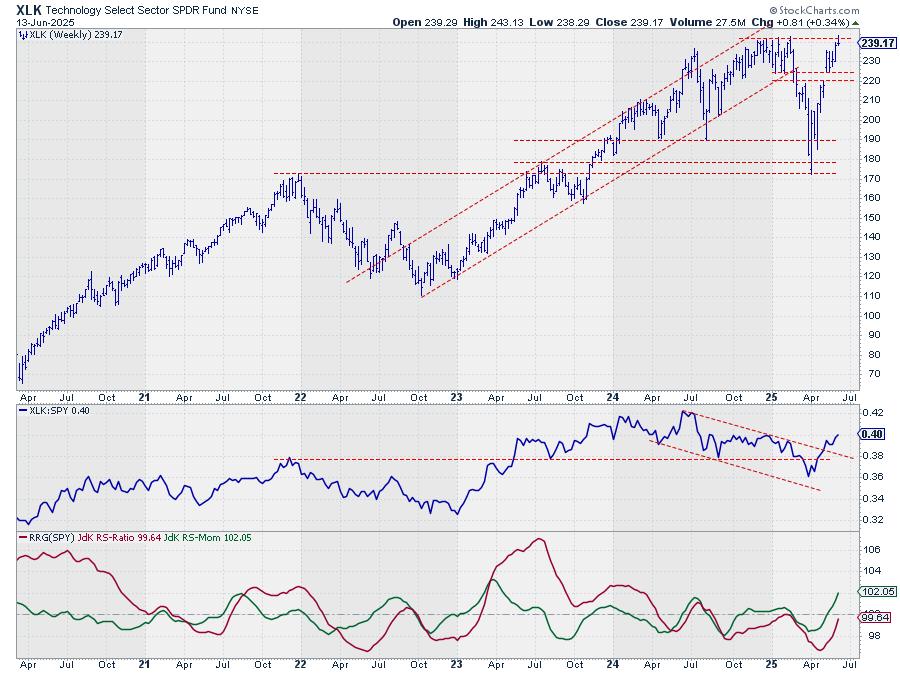
XLK, the new kid on the block (again), tested its overhead resistance level around $244, peaking slightly above it last week before closing lower.
Recent strength has pushed the raw RS line convincingly higher, taking out its previous peak from mid-December.
Both RRG lines are pointing strongly upward, with RS-Momentum already above 100 and RS-Ratio rapidly approaching 100.
Portfolio Performance
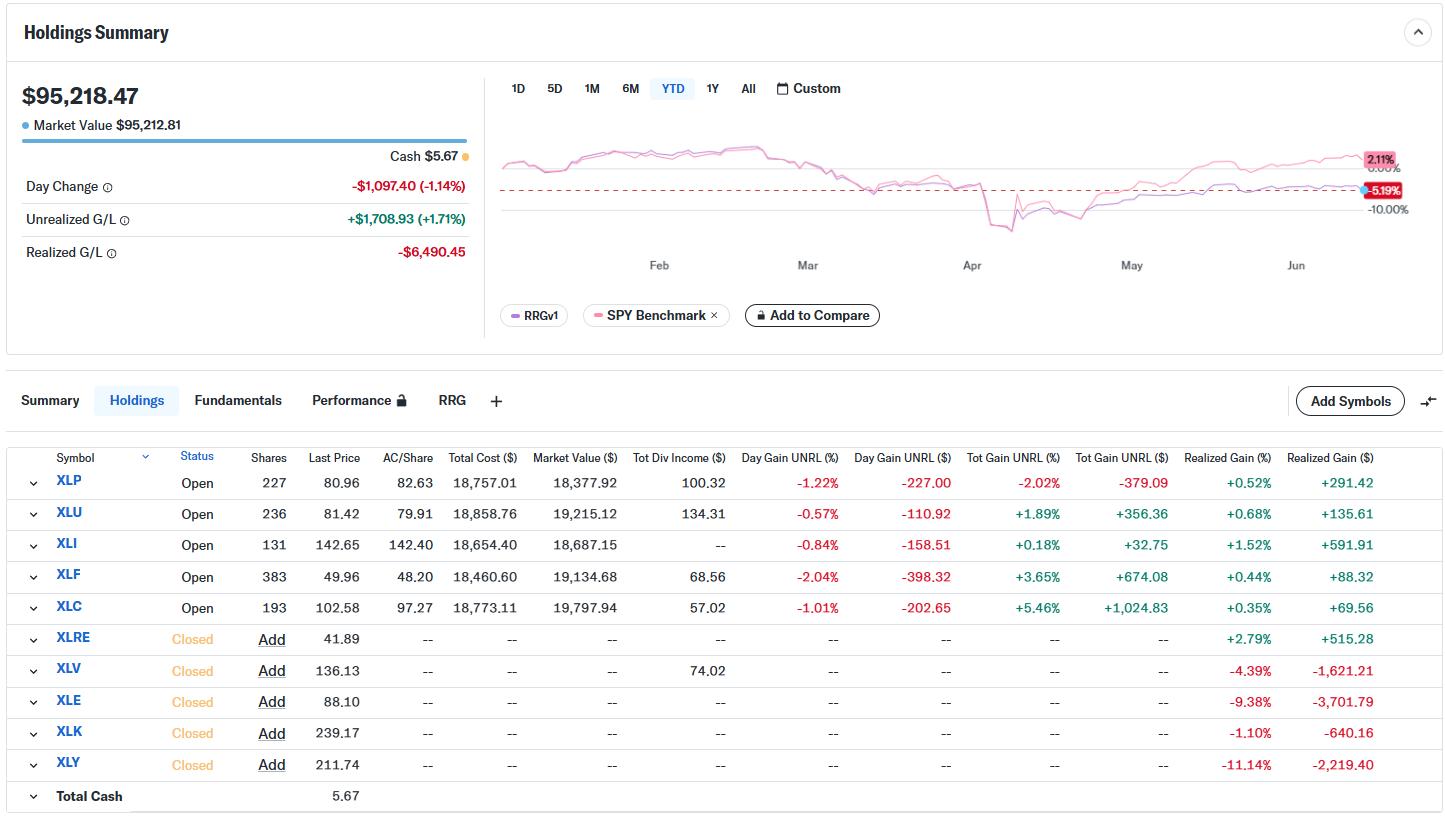
With all this sector leapfrogging, especially involving the heavyweight Technology sector, the gap between the top five sectors’ performance and SPY has widened to around 7%.
The drawdown continues, but I’m sticking with this experiment and trusting the model to come back and start beating SPY again.
Yes, a 7% lag sounds significant (and it is), but it can change rapidly in such a concentrated portfolio. One or two strong weeks could easily turn this performance around, particularly if big sectors like Technology and potentially Consumer Discretionary become part of the top five.
#StayAlert and have a great week. –Julius
Julius de Kempenaer
Senior Technical Analyst, StockCharts.com
Creator, Relative Rotation Graphs
Founder, RRG Research
Host of: Sector Spotlight
Please find my handles for social media channels under the Bio below.
Feedback, comments or questions are welcome at [email protected]. I cannot promise to respond to each and every message, but I will certainly read them and, where reasonably possible, use the feedback and comments or answer questions.
To discuss RRG with me on S.C.A.N., tag me using the handle Julius_RRG.
RRG, Relative Rotation Graphs, JdK RS-Ratio, and JdK RS-Momentum are registered trademarks of RRG Research.

Julius de Kempenaer is the creator of Relative Rotation Graphs™. This unique method to visualize relative strength within a universe of securities was first launched on Bloomberg professional services terminals in January of 2011 and was released on StockCharts.com in July of 2014.
After graduating from the Dutch Royal Military Academy, Julius served in the Dutch Air Force in multiple officer ranks. He retired from the military as a captain in 1990 to enter the financial industry as a portfolio manager for Equity & Law (now part of AXA Investment Managers).
Learn More
Source link


