
KEY
TAKEAWAYS
- No changes in sector positions last week — a rare occurrence
- Industrials maintain lead, while Utilities and Consumer Staples show signs of weakening
- Daily RRG reveals nuanced movements within improving and weakening quadrants
- Top 5 sectors maintain defensive positioning, leading to continued underperformance vs SPY
Sector Rotation: A Week of Stability Amidst Market Dynamics
Last week presented an intriguing scenario in our sector rotation portfolio.
For the first time in recent memory, we witnessed complete stability across all sector positions — no changes whatsoever in the rankings.
- (1) Industrials – (XLI)
- (2) Utilities – (XLU)
- (3) Consumer Staples – (XLP)
- (4) Communication Services – (XLC)
- (5) Financials – (XLF)
- (6) Technology – (XLK)
- (7) Real-Estate – (XLRE)
- (8) Materials – (XLB)
- (9) Consumer Discretionary – (XLY)
- (10) Healthcare – (XLV)
- (11) Energy – (XLE)
Weekly RRG: Steady as She Goes
The weekly Relative Rotation Graph (RRG) continues to paint a picture of gradual shifts. Utilities and Consumer Staples, while still occupying high RS ratio levels, are moving lower on the chart. Utilities clings to the leading quadrant, but Consumer Staples has just crossed into weakening territory.
Financials and Communication Services remain in the weakening quadrant, but their RS momentum levels have stabilized. Communication Services shows a slight uptick, while Financials maintains a negative heading — albeit well above the 100 mark.
Industrials, our current star performer, continues its reign in the leading quadrant. It’s gaining ground on the RS ratio axis while experiencing a minor dip in RS momentum. All in all, the weekly picture remains essentially unchanged from last week.
Daily RRG
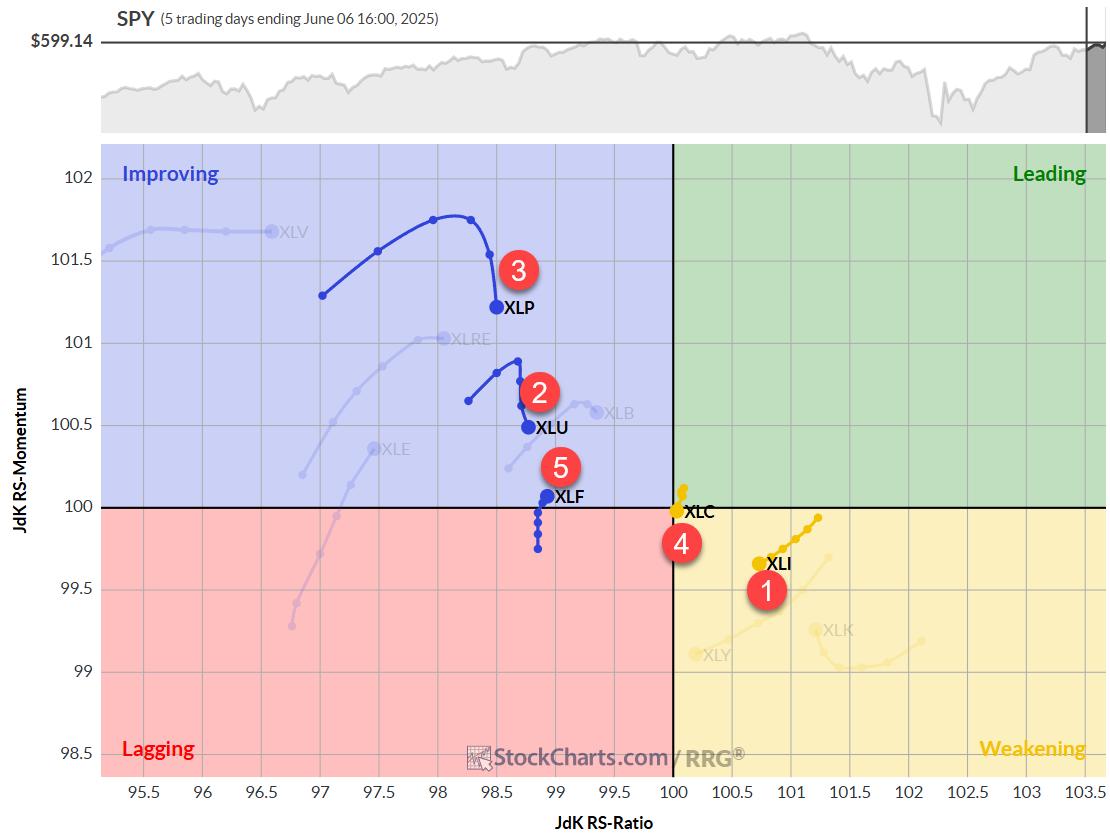
Shifting our focus to the daily RRG, we start to see more nuanced movements:
- Staples and Utilities are rotating within the improving quadrant, losing ground on the RS momentum axis without gaining in RS ratio. This suggests further weakening on the weekly chart is likely.
- Financials have made their way into the improving quadrant — a positive development that builds on last week’s progress.
- Communication Services is practically aligned with the benchmark (SPY), showing little distinctive movement.
- Industrials continues deeper into the weakening quadrant, but — and this is crucial — its RRG velocity (the distance between tail nodes) is very low. This keeps the door open for a potential curl back up before hitting the lagging quadrant, which would reinforce its strong position.
Industrials: Breaking New Ground
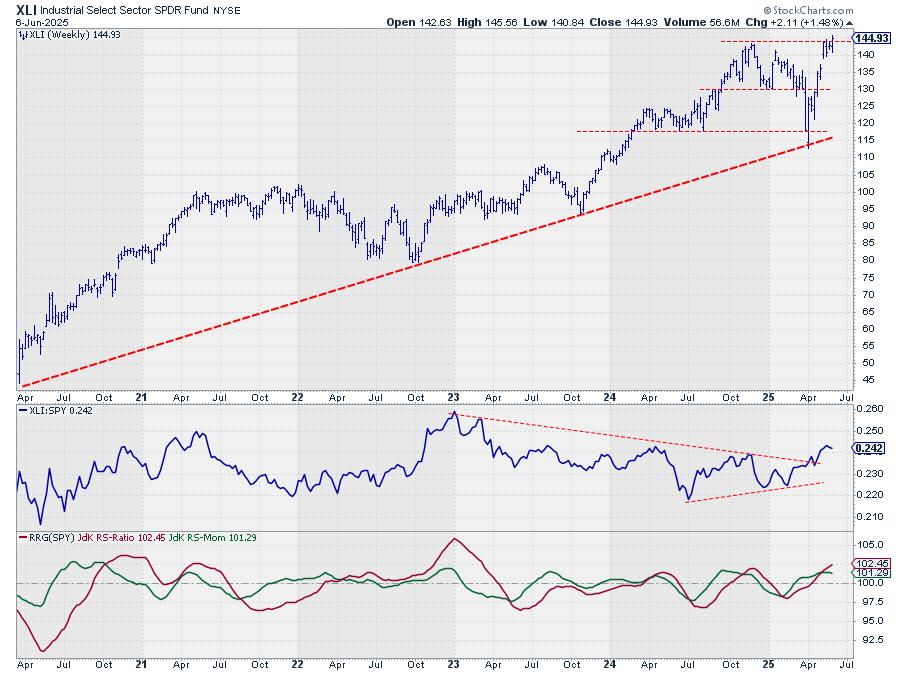
The price chart for Industrials is confirming its current strength with a break above overhead resistance.
This breakthrough is likely to unlock more upside potential, keeping the sector firmly at the top of our list.
The relative performance continues to reflect this positive momentum.
Utilities: Struggling at Resistance
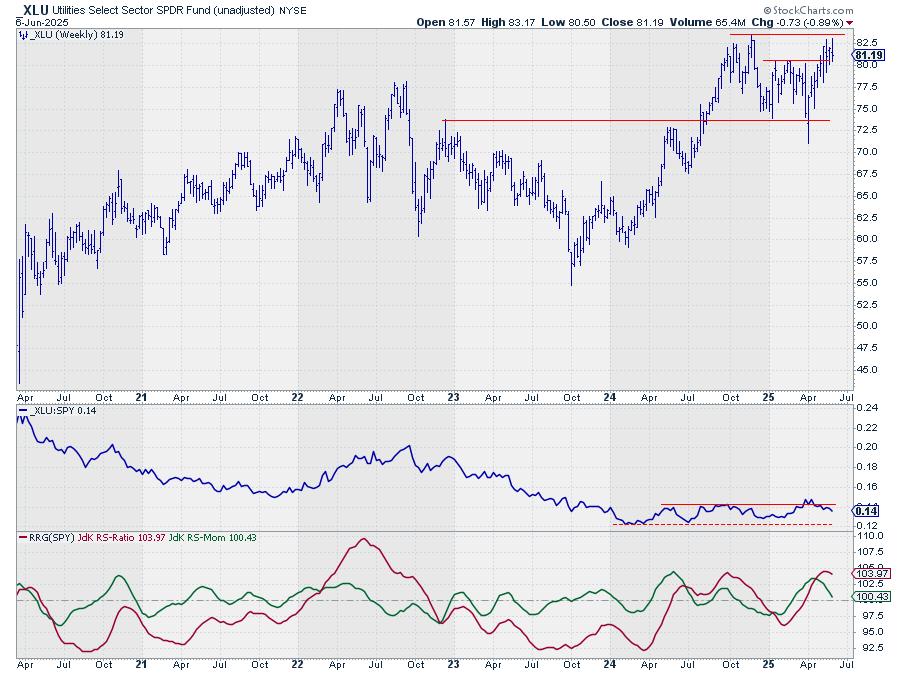
Once again, Utilities tested its overhead resistance (between 83 and 84) but failed to break higher.
Prices retreated into the range by week’s end. This setback is causing relative strength to drop back into its sideways trading range, with RRG lines rolling over.
The sector needs a swift improvement in both price and relative strength to maintain its recent strong position.
Consumer Staples: Déjà Vu
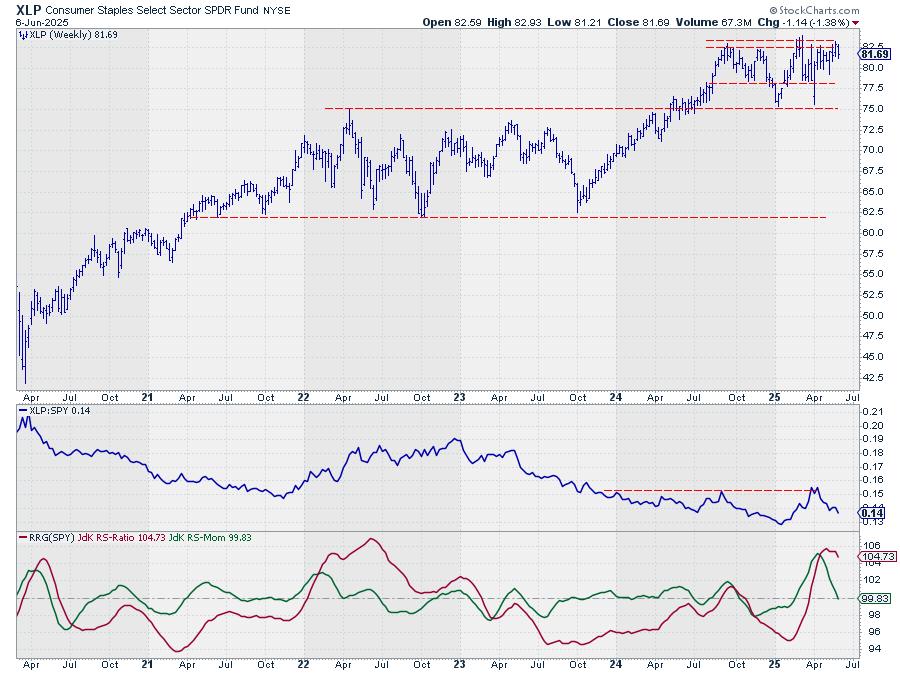
Consumer Staples finds itself in a similar boat to Utilities.
Another attempt to break overhead resistance around 83.5 was met with a pullback. This pattern has been repeating for weeks, and it’s taking its toll on the raw relative strength line.
While the RS ratio remains high — a legacy of strength since the year’s start — the rapid loss of relative momentum is causing the RS ratio to roll over.
Like Utilities, consumer staples need a quick price improvement to maintain its top-five position.
Communication Services: Closing In
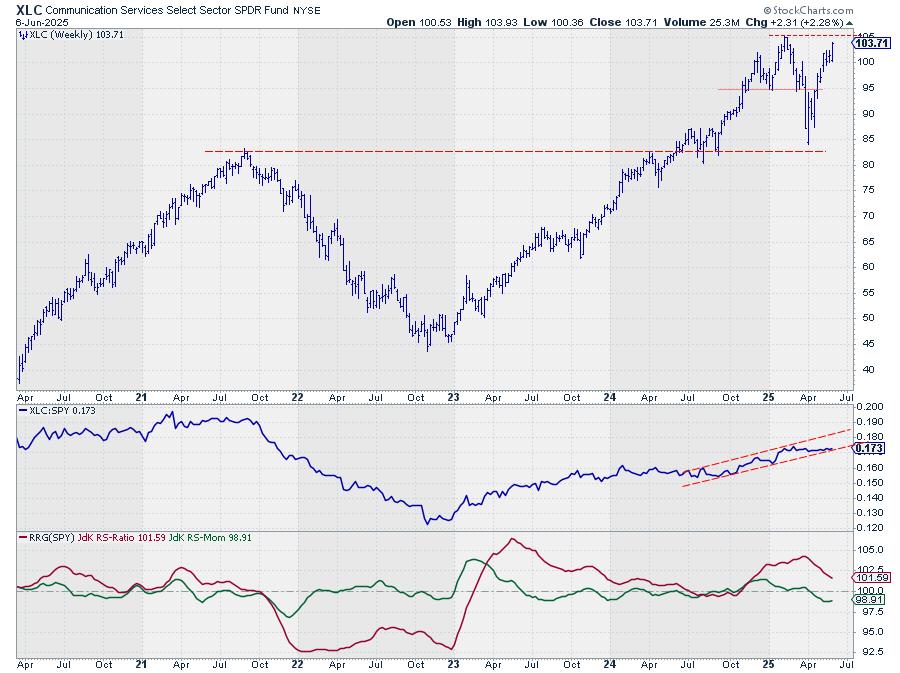
Communication Services had a strong week, closing near the range’s high end and approaching its previous peak just above 105.
This improvement has kept the raw relative strength line against SPY within its rising channel.
Continued strength, especially if XLC breaks above 105, should keep relative strength in an uptrend and likely cause the RRG lines to curl back up soon.
Financials: Battling Resistance
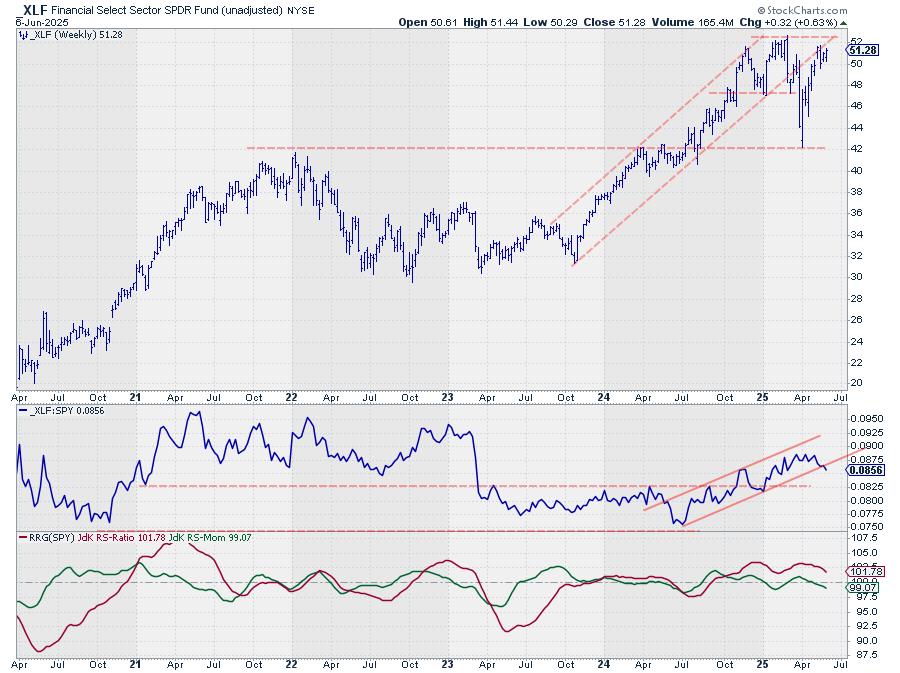
Financials continue to struggle with its old rising support line, now acting as resistance near the 52 area where the previous high is located.
This price stagnation has caused the raw RS line to break its rising support, leading the RRG lines to roll over.
The RS momentum line has already dropped below 100, and the RS ratio is starting to move lower.
We’ve seen the daily tail for XLF pick up slightly — this acceleration needs to continue in the coming weeks for XLF to maintain its top-five position.
Portfolio Performance

Due to the positions of Consumer Staples and Utilities, our top five remains defensively positioned. This has caused our underperformance versus SPY to widen slightly — we’re now just over 6% behind since the start of the year.
Is this ideal? Of course not. But here’s the thing — trend-following systems need time to play out. The worst thing you can do is abandon a strategy just because it’s going against you for a few months. (And let’s be honest, it’s only been since May — so two months.)
I will stay the course, maintain discipline, and continue to track this portfolio based on our established metrics.
It’ll be interesting to see how long it takes for this strategy to come back on top and start outperforming SPY again. Patience is key in these situations.
#StayAlert and have a great wee. –Julius
Julius de Kempenaer
Senior Technical Analyst, StockCharts.com
Creator, Relative Rotation Graphs
Founder, RRG Research
Host of: Sector Spotlight
Please find my handles for social media channels under the Bio below.
Feedback, comments or questions are welcome at [email protected]. I cannot promise to respond to each and every message, but I will certainly read them and, where reasonably possible, use the feedback and comments or answer questions.
To discuss RRG with me on S.C.A.N., tag me using the handle Julius_RRG.
RRG, Relative Rotation Graphs, JdK RS-Ratio, and JdK RS-Momentum are registered trademarks of RRG Research.

Julius de Kempenaer is the creator of Relative Rotation Graphs™. This unique method to visualize relative strength within a universe of securities was first launched on Bloomberg professional services terminals in January of 2011 and was released on StockCharts.com in July of 2014.
After graduating from the Dutch Royal Military Academy, Julius served in the Dutch Air Force in multiple officer ranks. He retired from the military as a captain in 1990 to enter the financial industry as a portfolio manager for Equity & Law (now part of AXA Investment Managers).
Learn More
Source link